Comparative Analysis of Color Temperature and Illuminance in Dim-to-Warm LED Lamps

A research study by Dani Soares and Kevan Shaw

Abstract

This research seeks to identify the most suitable LED lamp for the comprehensive replacement of obsolete halogen systems, emphasizing color temperature and illuminance requirements. Focusing on two prevalent lamp types, G9 and E14/E27, our study investigates the perceived and measured color temperature of LEDs under both trailing and leading edge control systems. Given uncertainty about the existing control system, our approach encompasses both, ensuring relevance for future decision-making.

Through rigorous experimentation, LED lamps underwent testing to measure color temperature and illuminance, evaluating their efficacy as halogen replacements. Theoretical considerations propose that trailing edge control

demonstrates superior efficiency in modulating illuminance by their ability in controlling lower wattage loads. On the contrary, leading phase dimming are more suitable to incandescent and halogen lamps due to their predominant resistive load technology rather than capacitive or inductive.

Results reveal distinctive responses under trailing and leading edge control, providing practical insights into selecting LED lamps for the complete replacement of halogen systems, considering both G9 and E14/E27 options. The dual consideration of control systems ensures adaptability to varying technological landscapes, facilitating informed decisions in transitioning to energy-efficient lighting systems.


Introduction

In the pursuit of energy-efficient lighting solutions, the evolution of Light Emitting Diodes (LEDs) stands as a cornerstone, promising both sustainability and enhanced performance. As the global shift towards greener technologies accelerates, the replacement of obsolete halogen systems with advanced LED counterparts becomes imperative. This research endeavors to navigate the intricate landscape of LED technology, specifically addressing the selection dilemma between G9 and E14/E27 lamp types, with a nuanced focus on color temperature and illuminance.

Halogen lighting systems, once pervasive, now face obsolescence due to their inefficiency and environmental impact. LED lamps emerge as a compelling alternative, boasting longevity, energy efficiency, and reduced environmental footprint. However, the varied characteristics of G9 and E14/E27 lamp types pose a challenge in determining the optimal replacement for halogen counterparts.

The color temperature and illuminance of lighting systems play pivotal roles in shaping the ambiance and functionality of a space. To address this, our research embarks on a comprehensive analysis, considering not only the lamp types but also the influence of control systems.

Amidst this backdrop of technological evolution and theoretical considerations, our study aims to fill a critical gap by empirically evaluating the color temperature and illuminance of G9 and E14/E27 LED lamps. The ambiguity surrounding the control system—whether trailing or leading edge—adds a layer of complexity that necessitates a thorough investigation, ensuring the relevance of our findings for future decision-making.

By shedding light on the nuanced interplay between LED technologies, lamp types, and control systems, this research aims to guide the transition from halogen to LED lighting systems. In doing so, it contributes not only to the field of lighting technology but also to the broader discourse on sustainable and efficient energy consumption.


Methodology

1. Selection of LED Lamps:

The selection process commenced by identifying LED lamps that exhibit consistent illuminance and perceived color temperature outputs across various dimming levels. Emphasis was placed on ensuring the quality and stability of performance throughout the dimming range for all lamps, spanning from G9 to E14/E27.

For G9 LED lamps, the following models were selected:

  • Paulmann LED G9 2000 to 3000k

  • Unbranded G9-COB-3WD 2200 to 2800k

  • Unbranded LED Bulb G9 3W 2700 to 3200k

  • Crompton LED G9 Sunset Dim 3w 2800k - 2200k

For E27 LED lamps, the following models were chosen:

  • Tala Sphere I

  • Tungsgram 2000-2700K

  • Zico A60 GLS Clear

  • Zico A60 GLS Porcelain

Additionally, E14 LED lamps were included:

  • E14 Integral LED 1800 - 2700K 6W

  • E14 Tala Sphere I dim to warm matte white

These selections were made to ensure a diverse representation of G9, E14, and E27 LED lamps, covering a range of color temperatures relevant to domestic and commercial settings.

At the conclusion of this initial phase, a meticulous selection was made, focusing on lamps that demonstrated superior consistency. This selection aimed to establish a pool of lamps suitable for further matching between G9 and Edison cap lamps.

Remarkably, only one G9 lamp successfully passed the rigorous criteria in the initial test— the Paulmann G9. This led to its inclusion as the representative G9 lamp for the subsequent phases of the study.

The subsequent phase involved attempting to match the chosen Paulmann G9 with all E14/E27 lamps through precise illuminance and color temperature measurements.

2. Experimental Setup:

The experimental setup was conducted within our office premises, ensuring a controlled environment conducive to accurate measurements of color temperature and illuminance.

The tools and measurement equipment utilized for this study were exclusively sourced in-house.

LED lamps, including the Paulmann G9, E14, and E27 lamps, were installed in standardized fixtures, replicating conditions typical of home or commercial settings.

The control panel used for the experiments included a mode-lighting control panel, specifically an eDin+ 4x3A Leading Edge Dimmer Din-03-04-Plus, and an eDin+ 4x2A Trailing Edge Dimmer Din-02-04-Te-Plus.

The control panel allowed seamless transitions between leading and trailing edge control systems, providing a comprehensive evaluation of the lamps’ performance under different conditions.

3. Measurement Instruments:

The measurement tool employed for this study was the Asensetek Lighting Passport, paired with the appropriate SGM app.

During the initial testing phase, we relied solely on visual observation without the use of any tools. This phase aimed to assess our subjective perception of color temperature and illuminance, emphasizing the consistency between two bulbs of the same model, rather than seeking precise measurements.

Calibrated light meters were used for accurate measurement of illuminance levels, ensuring reliable and precise data collection.

4. Data Collection:

In the first phase, perceived color temperature and illuminance levels were assessed visually, relying on human perception rather than measurement tools. The focus was on the consistency between two bulbs of the same model. In subsequent phases, systematic testing of each G9, E14, and E27 LED lamp was conducted under both trailing and leading edge control systems relying on the tools previously mentioned.

Measurements were recorded at various dimming levels, from 0 to 100% in close intervals, to capture the dynamic range of each LED lamp.

5. Data Validation / Limitations:

Repeated measurements were consistently conducted in alignment with subjective assessments from the initial testing phase and throughout the entirety of the data collection process.

In the initial testing phase, reliant on visual observation without tools, subjective assessments on perceived color temperature and illuminance were provided for both bulbs of the same model. This qualitative assessment serves as a valuable reference point for validating the later quantitative measurements.

Figure 1 highlights a specific case where inconsistencies in measurements were detected, potentially attributed to a faulty bulb. This underscores the importance of cross-verification and the necessity of addressing anomalies in the data.

The ambient lighting conditions were ideal, with the background lighting in the enclosed space nearly reduced to zero.

Through the meticulous implementation of this methodology, the study aims to generate robust data on the color temperature and illuminance characteristics of the specified G9, E14, and E27 LED lamps under different control systems, contributing valuable insights to the broader discourse on sustainable lighting solutions.

Figure 1 shows the data collected for the E27 Zico A60 GLS Clear after our first visual assessment. After an initial swap to identify the source of the discrepancy, we can infer that most likely we were dealing with afaulty LED bulb. (Grey)


Results - Consistency

G9 Consistency

Perceived Color Temperature and Illuminance.

Method: Visual Assessment

Measurements were conducted with a focus on the selected G9 lamps for this project. Notably, a notable level of inconsistency was observed across the chosen lamps, primarily stemming from a lack of color temperature uniformity. Additional notes include:

For the G9-COB-3WD lamps, a swap was implemented, and the subsequent results exhibited consistency with the initial findings. This adjustment aimed to discern whether the issue lay with the control panel or the lamp itself.

Regarding the LED BulB G9 3W, it presented a close match to the previous model, but a discernible pink tone emerged from 30% brightness onwards on L2.

The Crompton model displayed a significant difference, leaving little room for doubt.

In the case of the Paulmann model, despite a slight tone difference (Red) at L2, the match remained reasonably consistent across all dimming levels.

The Model chosen for the next phase was the Paulmann G9.

E27 Consistency

Perceived Color Temperature and Illuminance.

Method: Visual Assessment

In the case of the E27 models, measurements were conducted following the methods employed in the initial phase. Unlike the assessed lamp type discussed earlier, it is evident that there is a notable and consistent level of uniformity across all models.

All the models were subsequently considered for the next phase.

E14 Consistency

Perceived Color Temperature and Illuminance.

Method: Visual Assessment

In the case of the E14 models, measurements were conducted following the methods employed in the initial phase. Tala’s results, although consistent in terms of illuminance, it showed clear color temperature distinction between the two lamps. On the other hand, Integral LED showed good consistency from the 1% dimming level, being the only lamp capable of operating at such low levels.

Only Integral LED was considered for the next matching phase.


Results - Leading Edge Match

Control System: Leading Edge

Matching Test G9 - E27 - E14

Measured Color Temperature (K) and Illuminance (lux).

Method: Asesentek Lighting Passport


Results - Trailing Edge Match

Control System: Trailing Edge

Matching Test G9 - E27 - E14

Measured Color Temperature (K) and Illuminance (lux).

Method: Asesentek Lighting Passport


Discussion

All the products available in the replacement lamp category are primarily intended for domestic use. As such they are designed to meet competitive cost targets, and this seems to be the primary consideration over quality and consistency from product to product or batch to batch. This testing has been undertaken in consideration of using these lamps in commercial spaces, particularly hospitality where significant numbers are used together in the same space inviting visual comparison. The lamps tested were chosen on a quality / availability basis at the higher quality end of the market based on the retail prices of the products. Using Lamp replacement products is never a first choice. It is forced by the choice of, predominantly, decorative fittings by interior designers and the unwillingness of the producers of these fittings to engage with the complexities of LED technology.

The other aspect is the continuing use of lighting control systems and wiring with technology designed for power control of incandescent lamps. This system cuts the sine wave to reduce the power provided either by late switch on, leading edge, or early switch off trailing edge during each cycle. This works well for a resistive load such as incandescent but is disruptive for either capacitive loads, typical of most LED drivers or inductive loads such as wire wound transformers. Where minimal cost circuits are trying to control not only intensity but colour temperature as well, this becomes overwhelmingly challenging as we have demonstrated in this report.

Conclusion

The use of warm dim lamp replacement products is a conjunction of compromises that will result in lower quality lighting than that formerly provided by incandescent sources. The products are relatively expensive and as they will compromise the lit experience of the space and sometimes the appearance of expensive decorative fittings. Thought should be given as to whether the potential energy saving is worth it, at least while incandescent lamps are still available in the market.

Maintaining any visual consistency between fittings and spaces will require more work in visually setting up the lighting control system. Ultimately choices will need to be made between consistent colour appearance and consistent light levels. The variability of appearance between different lamps2 of the same batch further requires over ordering of lamps to allow any particularly visibly different lamps to be swapped out.

Ultimately, avoid using light fittings that use legacy lamp holders requiring lamp replacement technology and specify fittings that are designed around dedicated LED light sources.

Considering the data collected, it is our assessment that achieving an exact match may not be feasible. However, a reasonably close pair for consideration is the Paulmann G9 with the E27 Tala Sphere I LED bulb. This pairing demonstrates a minimal standard deviation of (-1.75%) compared to the closest alternative (20.25%) with the E27 Zico Porcelain LED.

Figure 2 demonstrates the variability of appearance even when dealing with the same bulb.

'Dimmable' G9 lamps: experiments in performance, by Claire Tomara & Kevan Shaw

Introduction

Revision A, 22.02.2019

Specifying LED retrofit lamps is part of the daily life of lighting designers, especially on hospitality projects. There is a great range of LED filament lamps on the market, especially E27 base, that claim to be dimmable. On many projects, decorative fittings use G9 rather than E27 lamps. The cost of decorative fittings using G9 or E27 lamps is less than fittings with integral LED modules. Many companies are not producing decorative fittings with integrated LED. While LED retrofit G9 lamps might sound like a lighting designer’s nightmare, there are a few companies available on the market that offer dimmable G9 LED lamps. Is it a dream come true or a continual nightmare?

As part of one of our recent hospitality projects, we decided it was necessary to test a few of these products for their dimming ability and control. 

Methodology

Equipment

The equipment used for the testing of G9 lamps is listed below:
- A Pendant fitting with three G9 bases
- Lighting control system with Trailing edge dimming and DALI outputs
- DALI Electronic trailing edge dimmer for incandescent lamps, electronic transformers and line voltage LED lamps
- Control software running on a web interface
- LED G9 dimmable lamps by two different manufacturers
- Halogen G9 to serve as a comparison
- Integration sphere, made in-house
- Conventional light meter
- Assenstek Essence Spectrophotometer
- MiniDSO 211 storage oscilloscope

Process

In order to begin the test, we set different levels of intensity through the control software;  the levels rise in 5% steps starting from 0% to 100%, with 3 second fade time.

At the beginning, we dim the lamp up and down from 0 to 100 with 7 seconds fade time to see the general dimming. Then, we start dimming up from 0 and every 5% until 100% to see and record any perceivable difference and flicker behaviour. 

After the general dimming test, we repeat the test using the integration sphere. This helped us to take relative light measurements at each dimming level. The measurements taken create the dimming curves that we will illustrate below.

We repeat the test using the trailing edge dimmer and DALI electronic trailing edge dimmer.  The minimum rated load for the trailing edge dimmer is not indicated. The minimum rated load for the DALI electronic trailing edge dimmer is 3 VA.

Challenges

Some of the difficulties we encountered while engaging with the test were the relative stability of light meter readings. The light meter was giving varying readings for a particular control setting. An average was taken to draw the dimming curve. In some cases, the light output was visibly unsteady, therefore we assume the variation in meter reading was in response to variations in light output of the lamp being tested through the duration of the reading.

The pendant we used for testing has three G9 bases. In some cases, we encountered the issue of LED lamps being on, even when the level was on 0%. We believe this to be a result of insufficient current to keep the dimmer triac latched off. This can be made worse through the very poor (capacitive) power factor of these lamps. In order to increase the load current, we used the halogen lamp in addition to the tested G9.  This allowed us to creating the curves for lamps that could not be individually controlled. In these situations, we are concerned that the actual dimming curve will vary when a resistive load is not applied to the dimming circuits in addition to the LED. However, the dimming curves of the LED still diverge from what we would expect.

Results

Lamp 1: Halogen G9 40W

Halogen lamps used to be the dominant light source in residential applications. They are known for their quality of light and specific dimming behaviour.  Halogen lamps are being taken off the market by EU regulations. We tested the halogen lamp in order to use it as point of reference for LED retrofit lamps.

When using the trailing edge dimmer, the lamp started visibly illuminating at 25%. The perceived fading up lasted until 90%-100%. While dimming down, the lamp stayed on until 20% and then faded off completely. The change in colour temperature of the lamp was not considered during this test.   

G1: This graph shows the dimming curve of the halogen lamp on the trailing edge dimmer

G1: This graph shows the dimming curve of the halogen lamp on the trailing edge dimmer

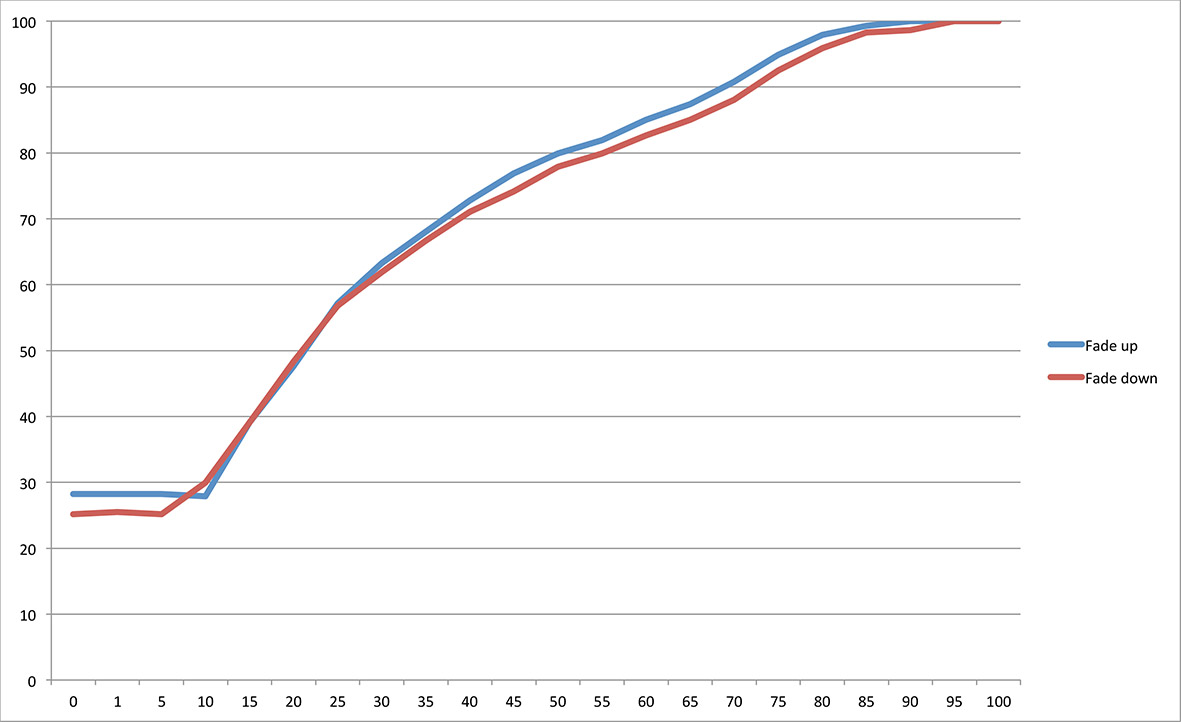
The graph shows a logarithmic curve that reaches a plateau at 90%. While on the trailing edge dimmer, the fading up and fading down curves are quite distinctive. While fading down, the light readings resulted in higher values than those during fading up. This must be caused by the internal control circuitry in this dimmer. 

G2: The graph shows the dimming curve of the halogen lamp on the DALI trailing edge dimmer

G2: The graph shows the dimming curve of the halogen lamp on the DALI trailing edge dimmer

The behaviour of the lamp stayed similar while fading both up and down, following a logarithmic curve. One of the main differences was that the lamp visibly illuminated from 1% gradually until 100% without reaching plateau.

G3: Graph of halogen lamp on mains dimming at 60%

G3: Graph of halogen lamp on mains dimming at 60%

G4: Graph of halogen lamp on DALI trailing edge dimmer at 60%

G4: Graph of halogen lamp on DALI trailing edge dimmer at 60%

What is the reason for the changing behaviour? A look at the graphs from the oscilloscope might give us a better understanding.

We can see some differences in the traces. Firstly, while they are taken from the same level, the curve is not cut at the same point. It seems that when the lamp is on, the mains dimming the curve is almost cut at its peak point, while on the DALI dimmer, it is cut at a lower point. In addition, the flat line looks smoother on the DALI dimmer than on the mains dimming. Both these devices are exhibiting different dimming curves and different trace patterns indicating different electronics to achieve the same anticipated results.

Lamp 2: LED G9 Dimmable 3W

After testing the halogen lamp, we continued the process testing LED dimmable G9 lamps from different manufacturers.

We have just one product type of Lamp 2. When we placed it to the pendant and on the trailing edge dimmer, the lamp was on at 0%.  At 10%, it flashed once and started fading up from 15%. It seemed to reach a plateau at approximately 50-60% as there was no significant change in intensity after 60%. The perceived fading down of the lamp started at 20% until 5% while it stayed on at 0%.  

G5: The graph shows the dimming curve of the single Lamp 2 on the trailing edge dimmer

G5: The graph shows the dimming curve of the single Lamp 2 on the trailing edge dimmer

The curve seems to be a square root curve which reaches a plateau at 90%. There are slight differences in the curves while fading up or down, while the lamp stayed on at 0%.

In order to stabilise the dimmer, we used the halogen lamp to increase the load, and repeated the test.

When Lamp 2 was placed with the halogen lamp, its dimming behaviour changed radically. Firstly, Lamp 2 was off at 0%. It turned on at 10% with a little delay and started dimming up gradually until 80%. At 85% there was a big step change in the intensity and then a gradual fade up at 90% when it reached plateau. 

Lamp 2 started fading down at 85%. At 80% there was a big step change in intensity and then it gradually faded down until 5%. At 5% it stayed on for a while but then turned off after few seconds. It  stayed off at 0%.

G6: The graph shows the dimming curve of Lamp 2 with the halogen lamp on the trailing edge dimmer

G6: The graph shows the dimming curve of Lamp 2 with the halogen lamp on the trailing edge dimmer

The graph shows a slightly off-linear dimming behaviour that reaches plateau at 90%. The fading up and fading down curves show slight differences, as the lamp stayed on, even for just a few seconds at 5% while fading down, although it only turns on at 10% with a little delay. It seems that the change in the load smoothes the square root curve of Lamp 2.

We repeated the test using the single Lamp 2 on the DALI electronic trailing edge dimmer.  The lamp was on at 0%. Its intensity was significantly less than when it was on the mains dimming. It stepped up at 1% and then gradually faded up until 100%. While dimming down, the lower levels seemed to be brighter than when the lamp was fading up. 

G7: The graph shows the dimming curve of the single Lamp 2 on the DALI electronic trailing edge dimmer

G7: The graph shows the dimming curve of the single Lamp 2 on the DALI electronic trailing edge dimmer

The dimming behaviour resulted in a linear curve with two peak points in the beginning at 1%, and at 95% at the end. While the first peak step was quite obvious to the naked eye, the second peak was not as perceivable as shown in the graph.

We repeated the test again using the halogen lamp to increase the load.  

G8: The graph shows the dimming curve of Lamp 2 with the halogen lamp on the DALI electronic trailing edge dimmer

G8: The graph shows the dimming curve of Lamp 2 with the halogen lamp on the DALI electronic trailing edge dimmer

As was the case on the trailing edge dimmer, the presence of the halogen lamp smoothed the linear curve of Lamp 2.  At the first peak at 1%, the lamp was obviously flickering. It then seemed to stabilise at 15%. The high peak was clearly perceivable from 90 to 95%.

A look at the traces from the oscilloscope demonstrates the differences.

G9: Single Lamp 2 on mains dimming at 10%

G9: Single Lamp 2 on mains dimming at 10%

G10: Lamp 2 with halogen on mains dimming at 10%

G10: Lamp 2 with halogen on mains dimming at 10%

G11: Single Lamp 2 on DALI electronic trailing edge dimmer at 10%

G11: Single Lamp 2 on DALI electronic trailing edge dimmer at 10%

G12: Lamp 2 with halogen on DALI electronic trailing edge dimmer at 10%

G12: Lamp 2 with halogen on DALI electronic trailing edge dimmer at 10%

When Lamp 2 is placed along with the halogen lamp, the diagrams look more as expected. Even here, we can see significant difference at the cut point of the curve, as when the lamp is on the DALI dimmer, the cut point is higher than when on mains.

The diagrams relating to Lamp 2 when the single lamp is in the pendant, look quite different to what was expected.  When on mains dimming, it seems that the wave never quite reaches a flat linear value, while on DALI dimmer, it seems to get closer to linear values, although we still cannot see the same linear curve as when Lamp 2 is placed along with the halogen lamp.

There are some very significant interactions between the electronics of the dimmers and the electronics in the lamps, particularly when there is a low load on the dimmer. This accounts for the unpredictable dimming and flickering. 

Lamp 3: LED G9 Dimmable 5W

We continued the experiment with another LED lamp, from a different manufacturer.  We had three items of the same product so that we could use them all at once on our pendant. This provided a more realistic situation, and at 15W, a minimum load.

The lamps were off at 0%, and started slightly turning on at 30%. Then, they gradually faded up until 95%, when they seemed to reach plateau. The lamps started gradually fading down after 90% until 40%. They turned completely off at 25%.  

G13: The graph shows the dimming behaviour of 3 x Lamp 3 on trailing edge dimmer

G13: The graph shows the dimming behaviour of 3 x Lamp 3 on trailing edge dimmer

The dimming curve tends to match the logarithmic curve of the halogen lamp, although it has a smaller curve radius that looks almost linear, with a starting point of 25% as 0. 

We repeated the test, dimming the lamps with the DALI electronic trailing edge dimmer.

Lamp 3 started to be very slightly on at 15%, and gradually faded up until 100%. While dimming down, it gradually faded off until 10% when it turned completely off. 

One of the main differences in behaviour of Lamp 3 while on the two different dimming systems was that on the DALI electronic trailing edge dimmer, the lamp flickered and looked unstable below 45%. This behaviour was not visible when the lamp was on the trailing edge dimmer. 

G14: The graph illustrates the dimming behaviour of 3 x Lamp 3 on the DALI electronic trailing edge dimmer

G14: The graph illustrates the dimming behaviour of 3 x Lamp 3 on the DALI electronic trailing edge dimmer

The dimming curve smoothed into a logarithmic curve, although slightly different from the curve   of the halogen lamp.

A look at the traces from the oscilloscope provides us with an interesting comparison.

G15: 3 x Lamp 3 on mains dimming at 30%

G15: 3 x Lamp 3 on mains dimming at 30%

G16: 3 x Lamp 3 on DALI electronic trailing edge dimmer at 10%

G16: 3 x Lamp 3 on DALI electronic trailing edge dimmer at 10%

The two traces are quite different. The second trace looks more like what we would expect     than the first trace. The cut point of the wave seems to be the same. The flat line of the second graph looks a little shaky, while it is completely distorted on the first trace, creating more curves.

Commentary

Our experiments showed that each lamp displayed different dimming behaviour on the different dimming systems. The dimming curves seem to be smoother when the lamps were on the DALI electronic trailing edge dimmer. In addition, they demonstrated a greater dimming range. 

How much of this range we can actually use or perceive? As discussed in the Lamp 3 results, the lamp demonstrated visible slow flicker, and was unstable for almost half of the dimming range.  This behaviour was not visible on the mains dimming. However, the dimming range of Lamp 3 on mains dimming was much reduced, compared with when the lamp was on the DALI dimmer. 

Lamp 2 demonstrated a greater dimming range on both dimmers. However, in both situations it needed the presence of the halogen lamp in order to stabilise the load and to ensure the lamp is turned off at 0%. In addition, it seemed that the DALI dimmer smoothed the dimming behaviour, even when there was a single Lamp 2 in the pendant.

Conclusions

On the basis of the testing undertaken so far, we do not believe that there is a safe specification for dimmable G9 lamps. We expect to see different performance depending on lamp type, dimmer type and total load per circuit. Dim to extinction is also unreliable and will vary with the load (number of lamps) per circuit, different wattages of lamps and different makes of lamp.

As different lamps of similar specification and performance show distinctly different curves, lamp replacement also becomes a potential problem, requiring the attendance of a controls programmer to re-set scenes according to the performance of new lamps.

Many of the lamps we received were in generic boxes, and most were not properly labelled to comply with EU EcoDesign regulations. The majority of lamps were purchased through online retailers, both specialist lamp sellers and Amazon. One manufacturer sent us a sample lamp, and within a week had sent another sample to the same specification. The only differences were the size of the box, the printing to the base of one lamp, the envelope of the other, one visibly different electronic component, and different codes printed on each lamp. 

It is not safe to assume the performance of, or to specify any of these products without a significant disclaimer as to their performance, and putting the onus on the installing contractor to undertake the necessary testing on site before bulk ordering lamps for any project.

Be sure to follow our posts, as we will continue experimenting and publishing our results. Until then, enjoy a small video demonstration of the varied dimming behaviour of three different lamps on mains dimming. 

Claire Tomara and Kevan Shaw, February 2019

Revision A, 22.02.2019
We recognised that the breaks appearing in the graphs relating to Lamp 2, in the earlier version of this report, were due to the auto-range error of the light meter. We repeated the readings using a light meter with controlled error range. We updated the graphs for Lamp 2 accordingly.

VR at Kelvin Lighting's Party Recap Video

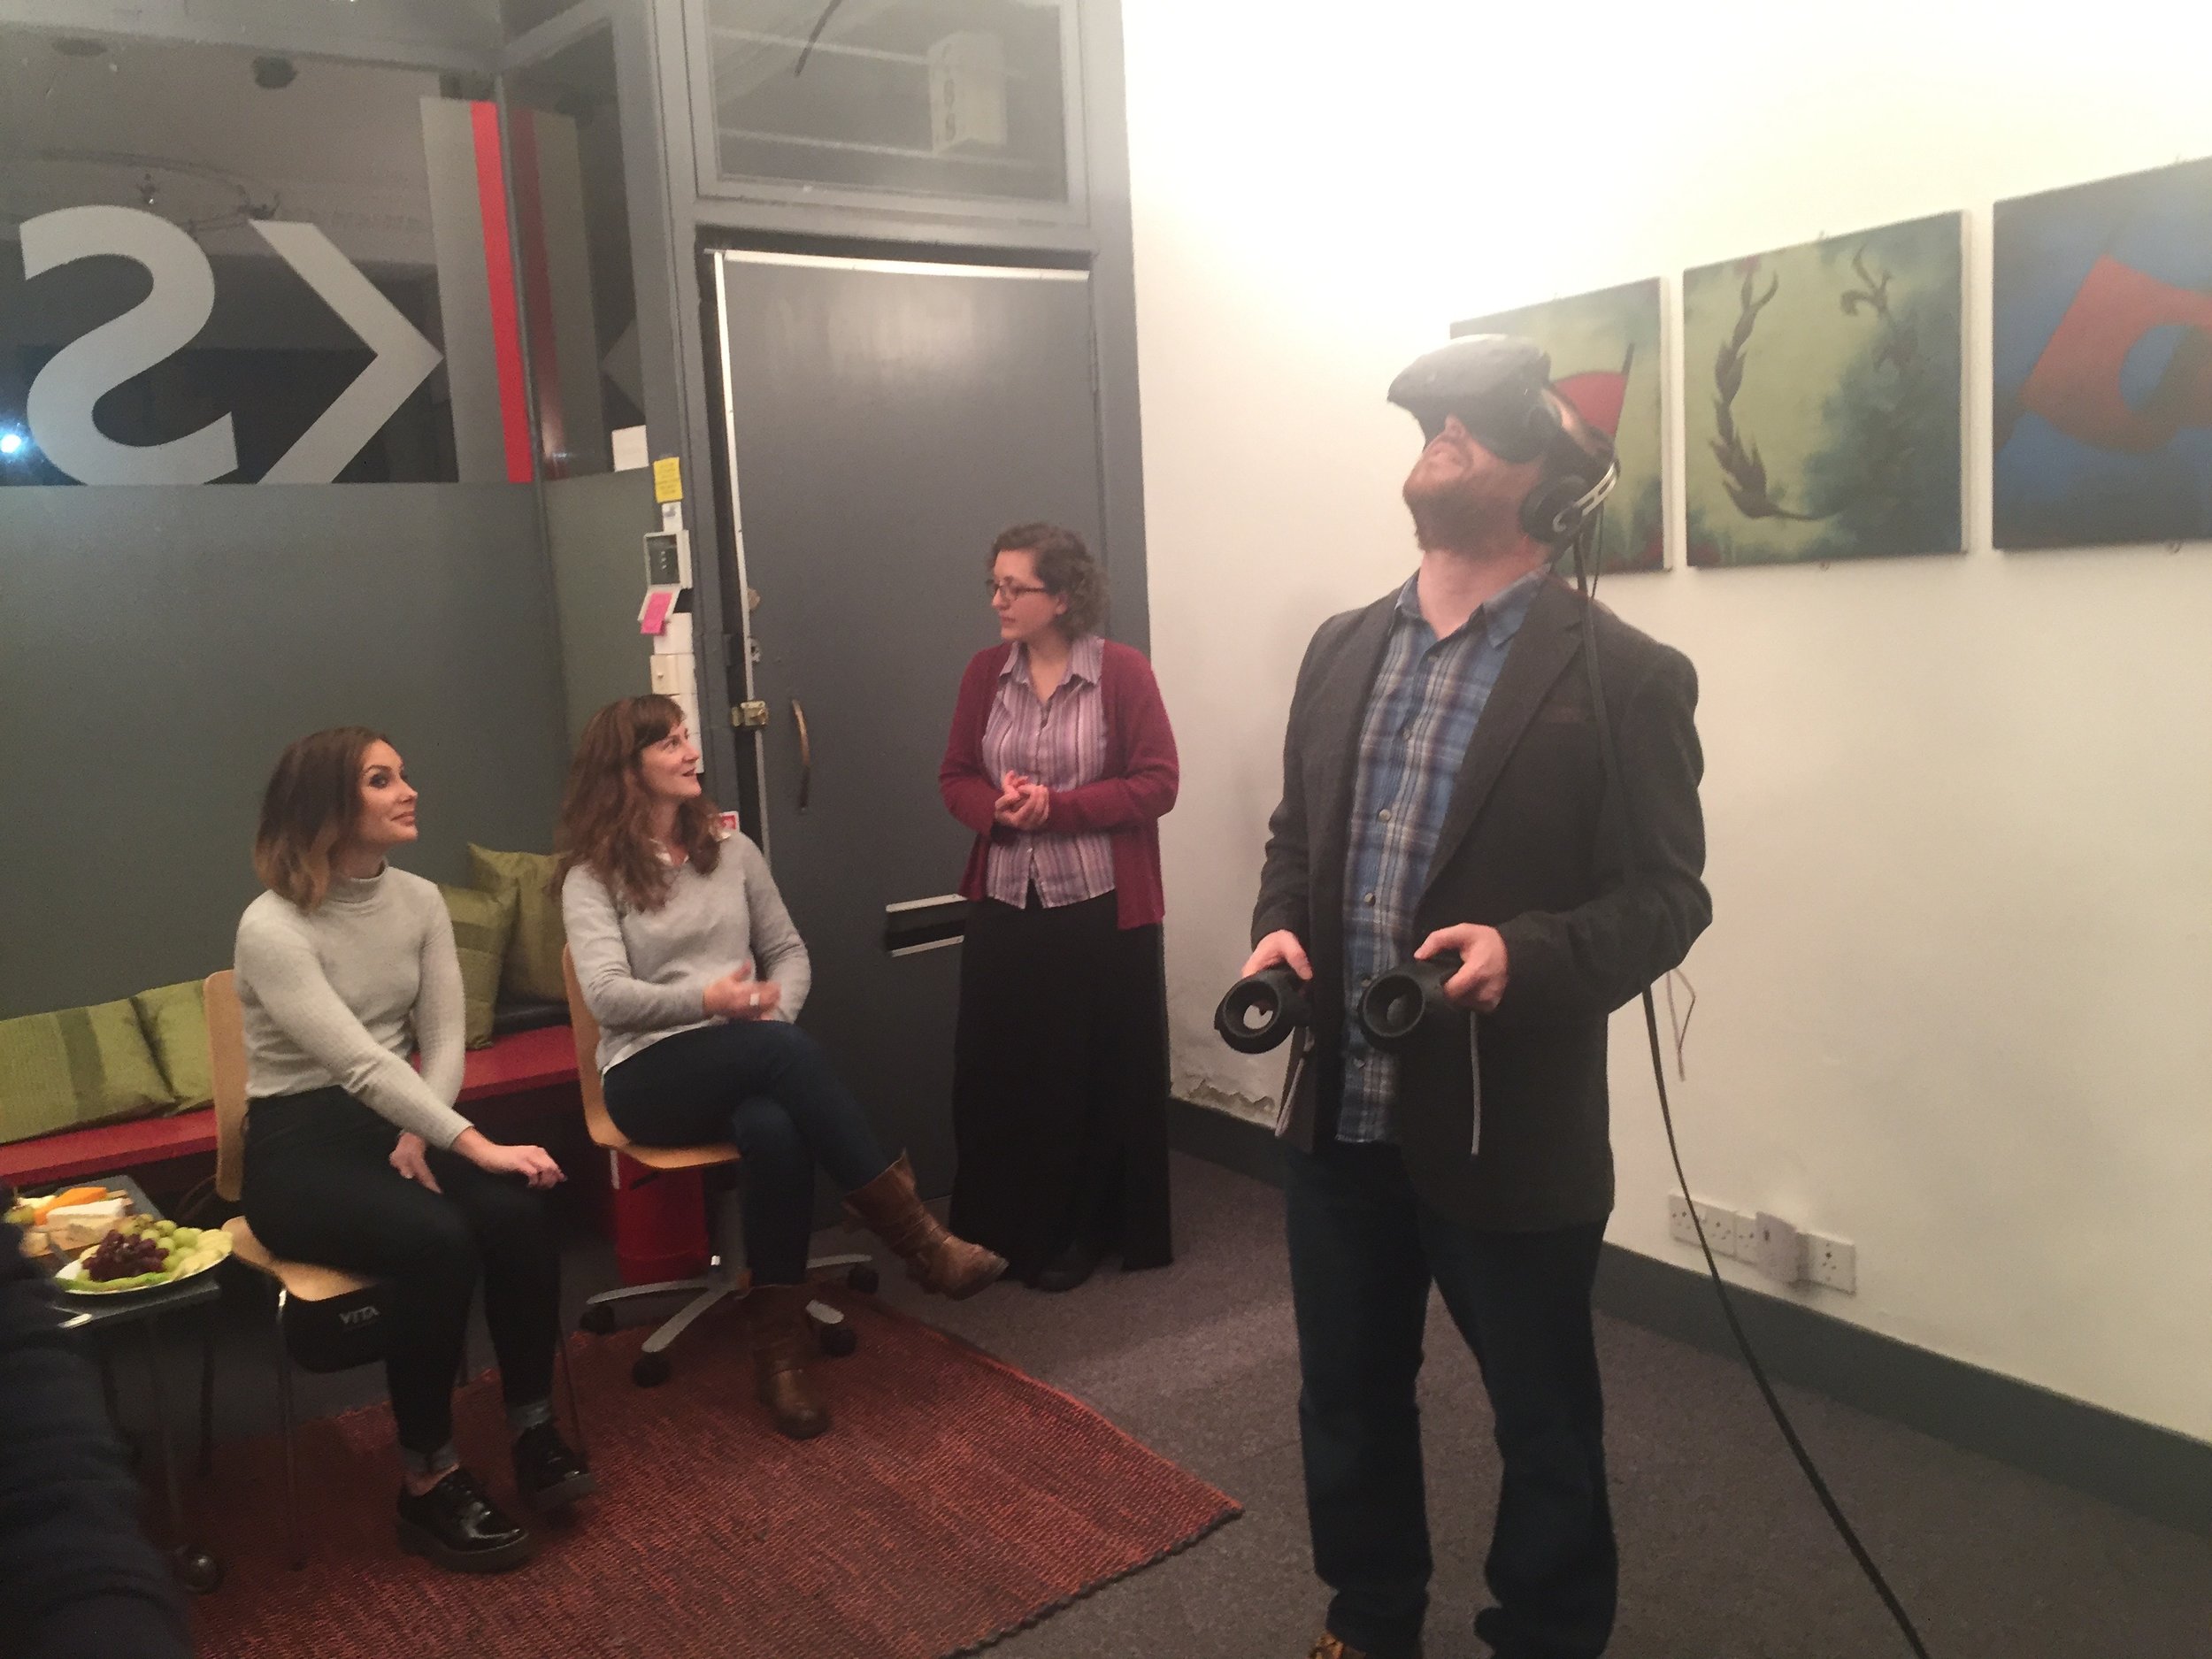
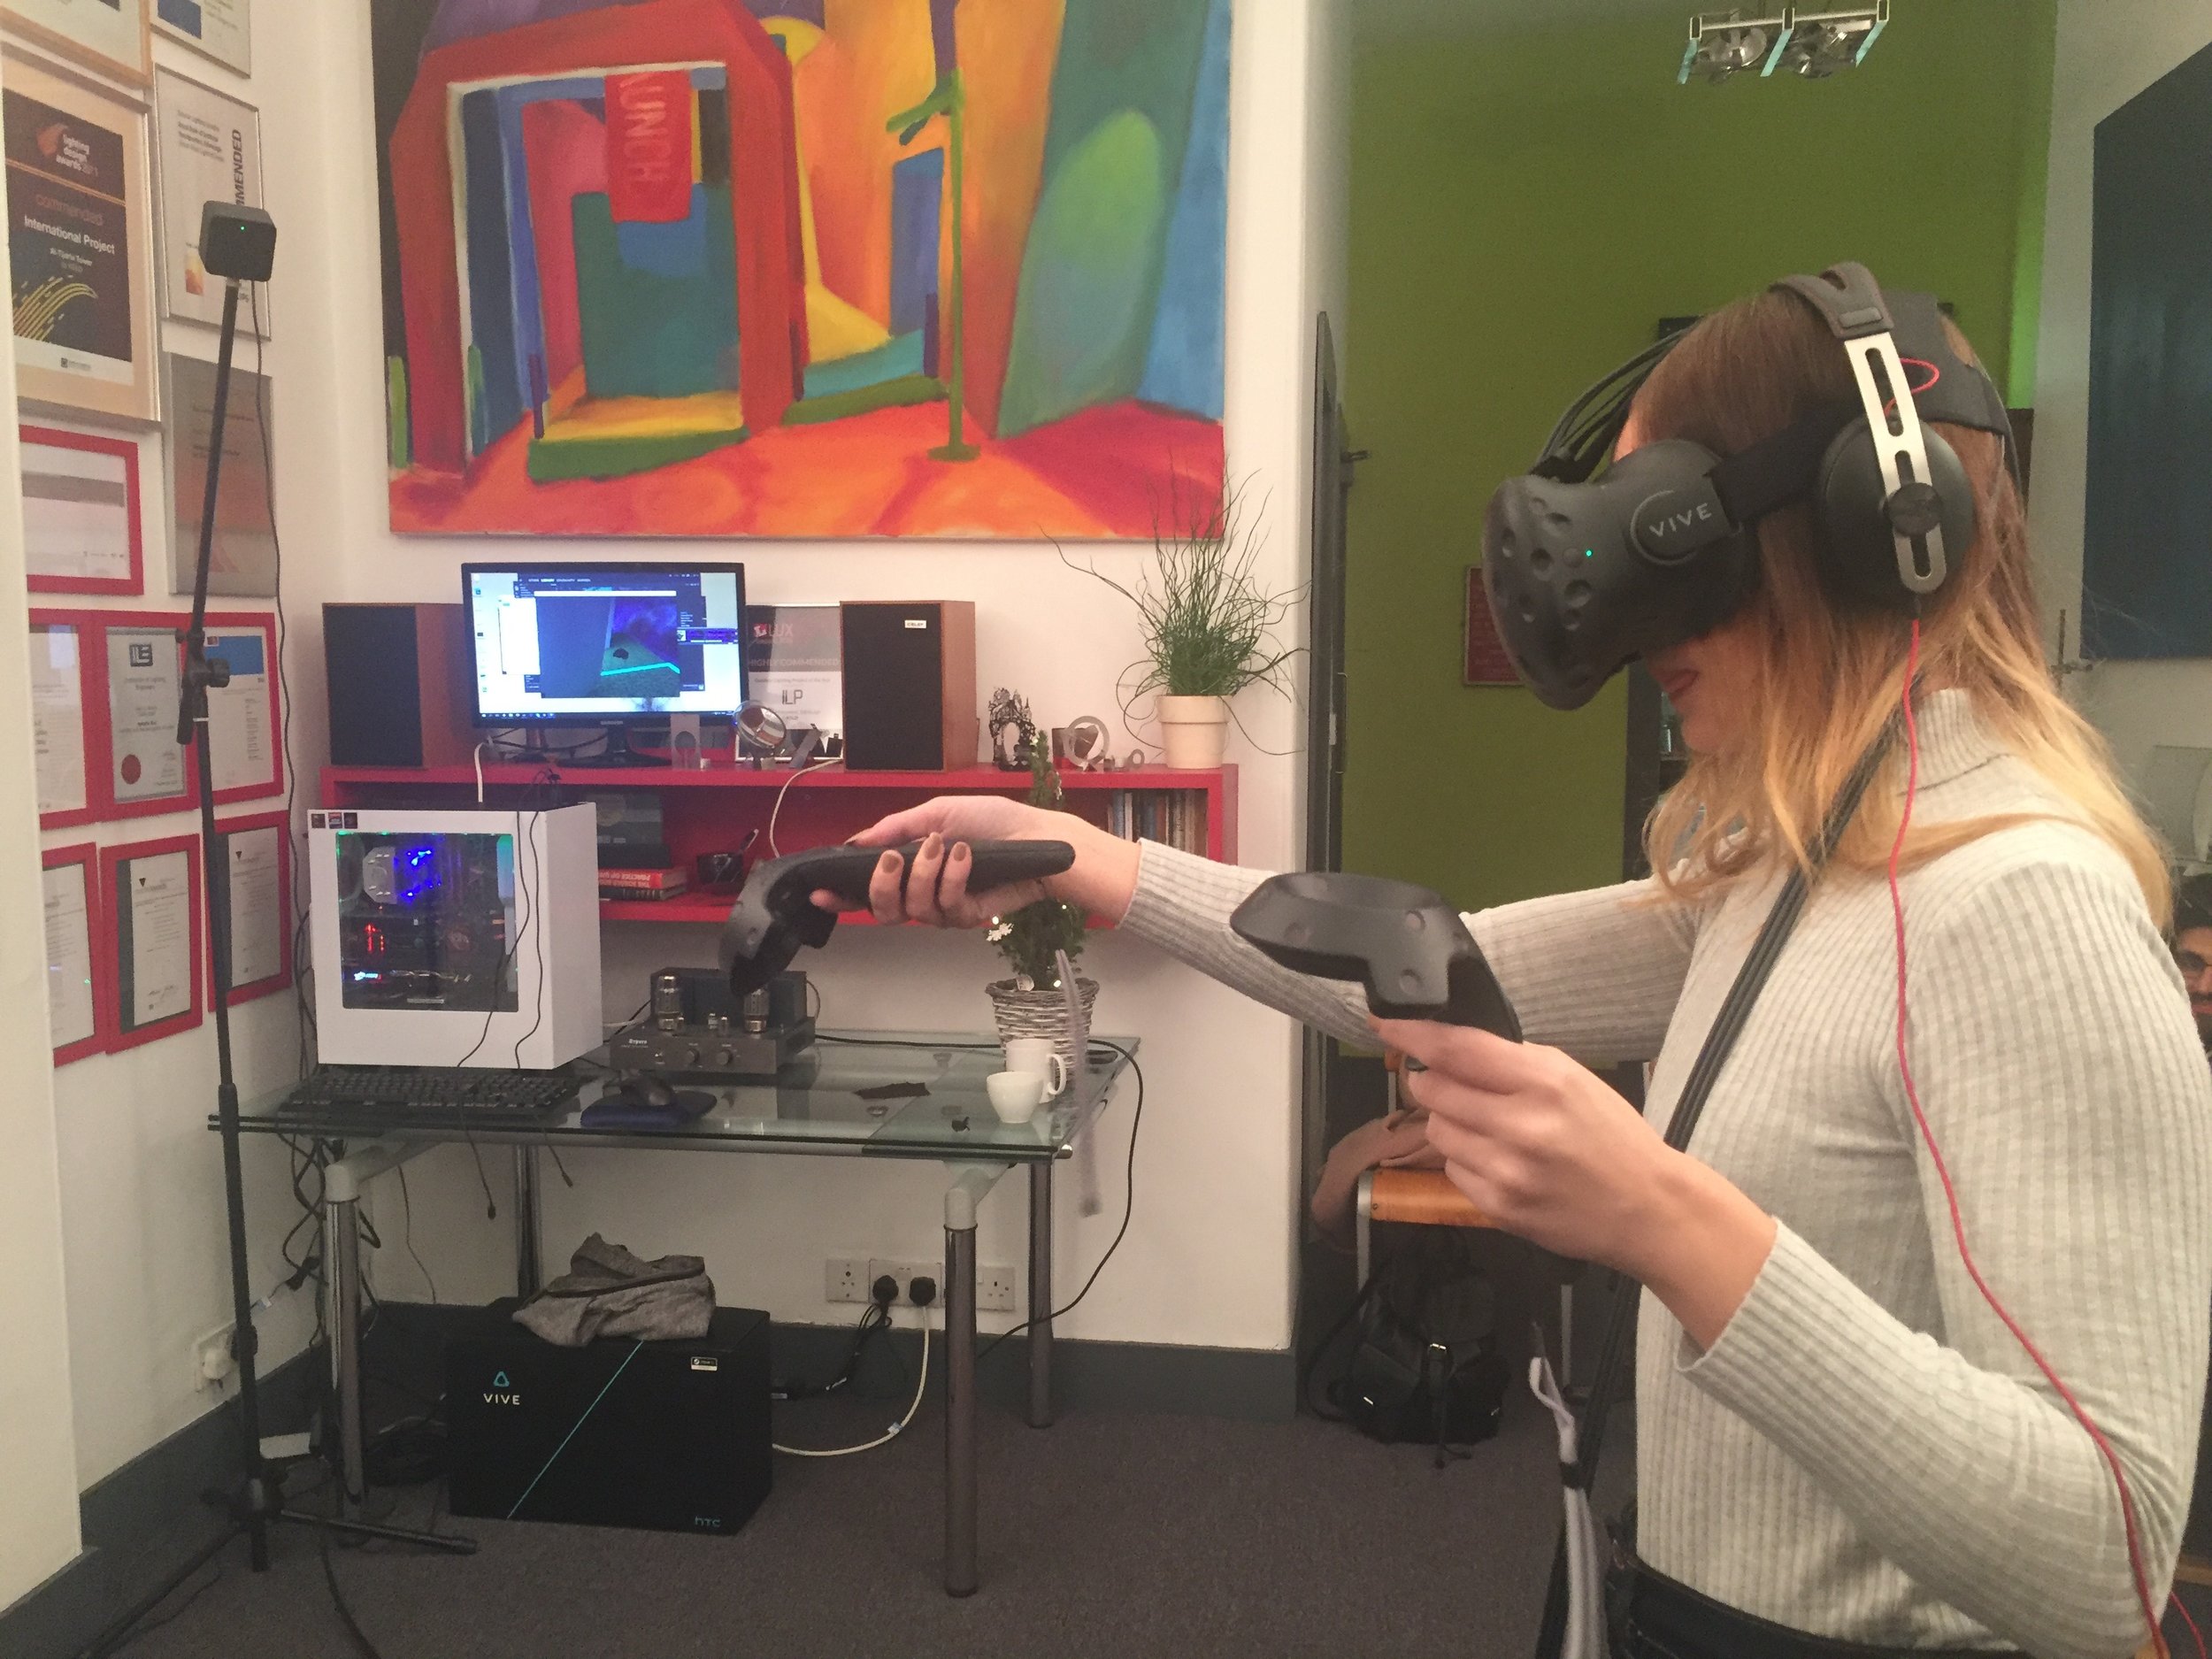
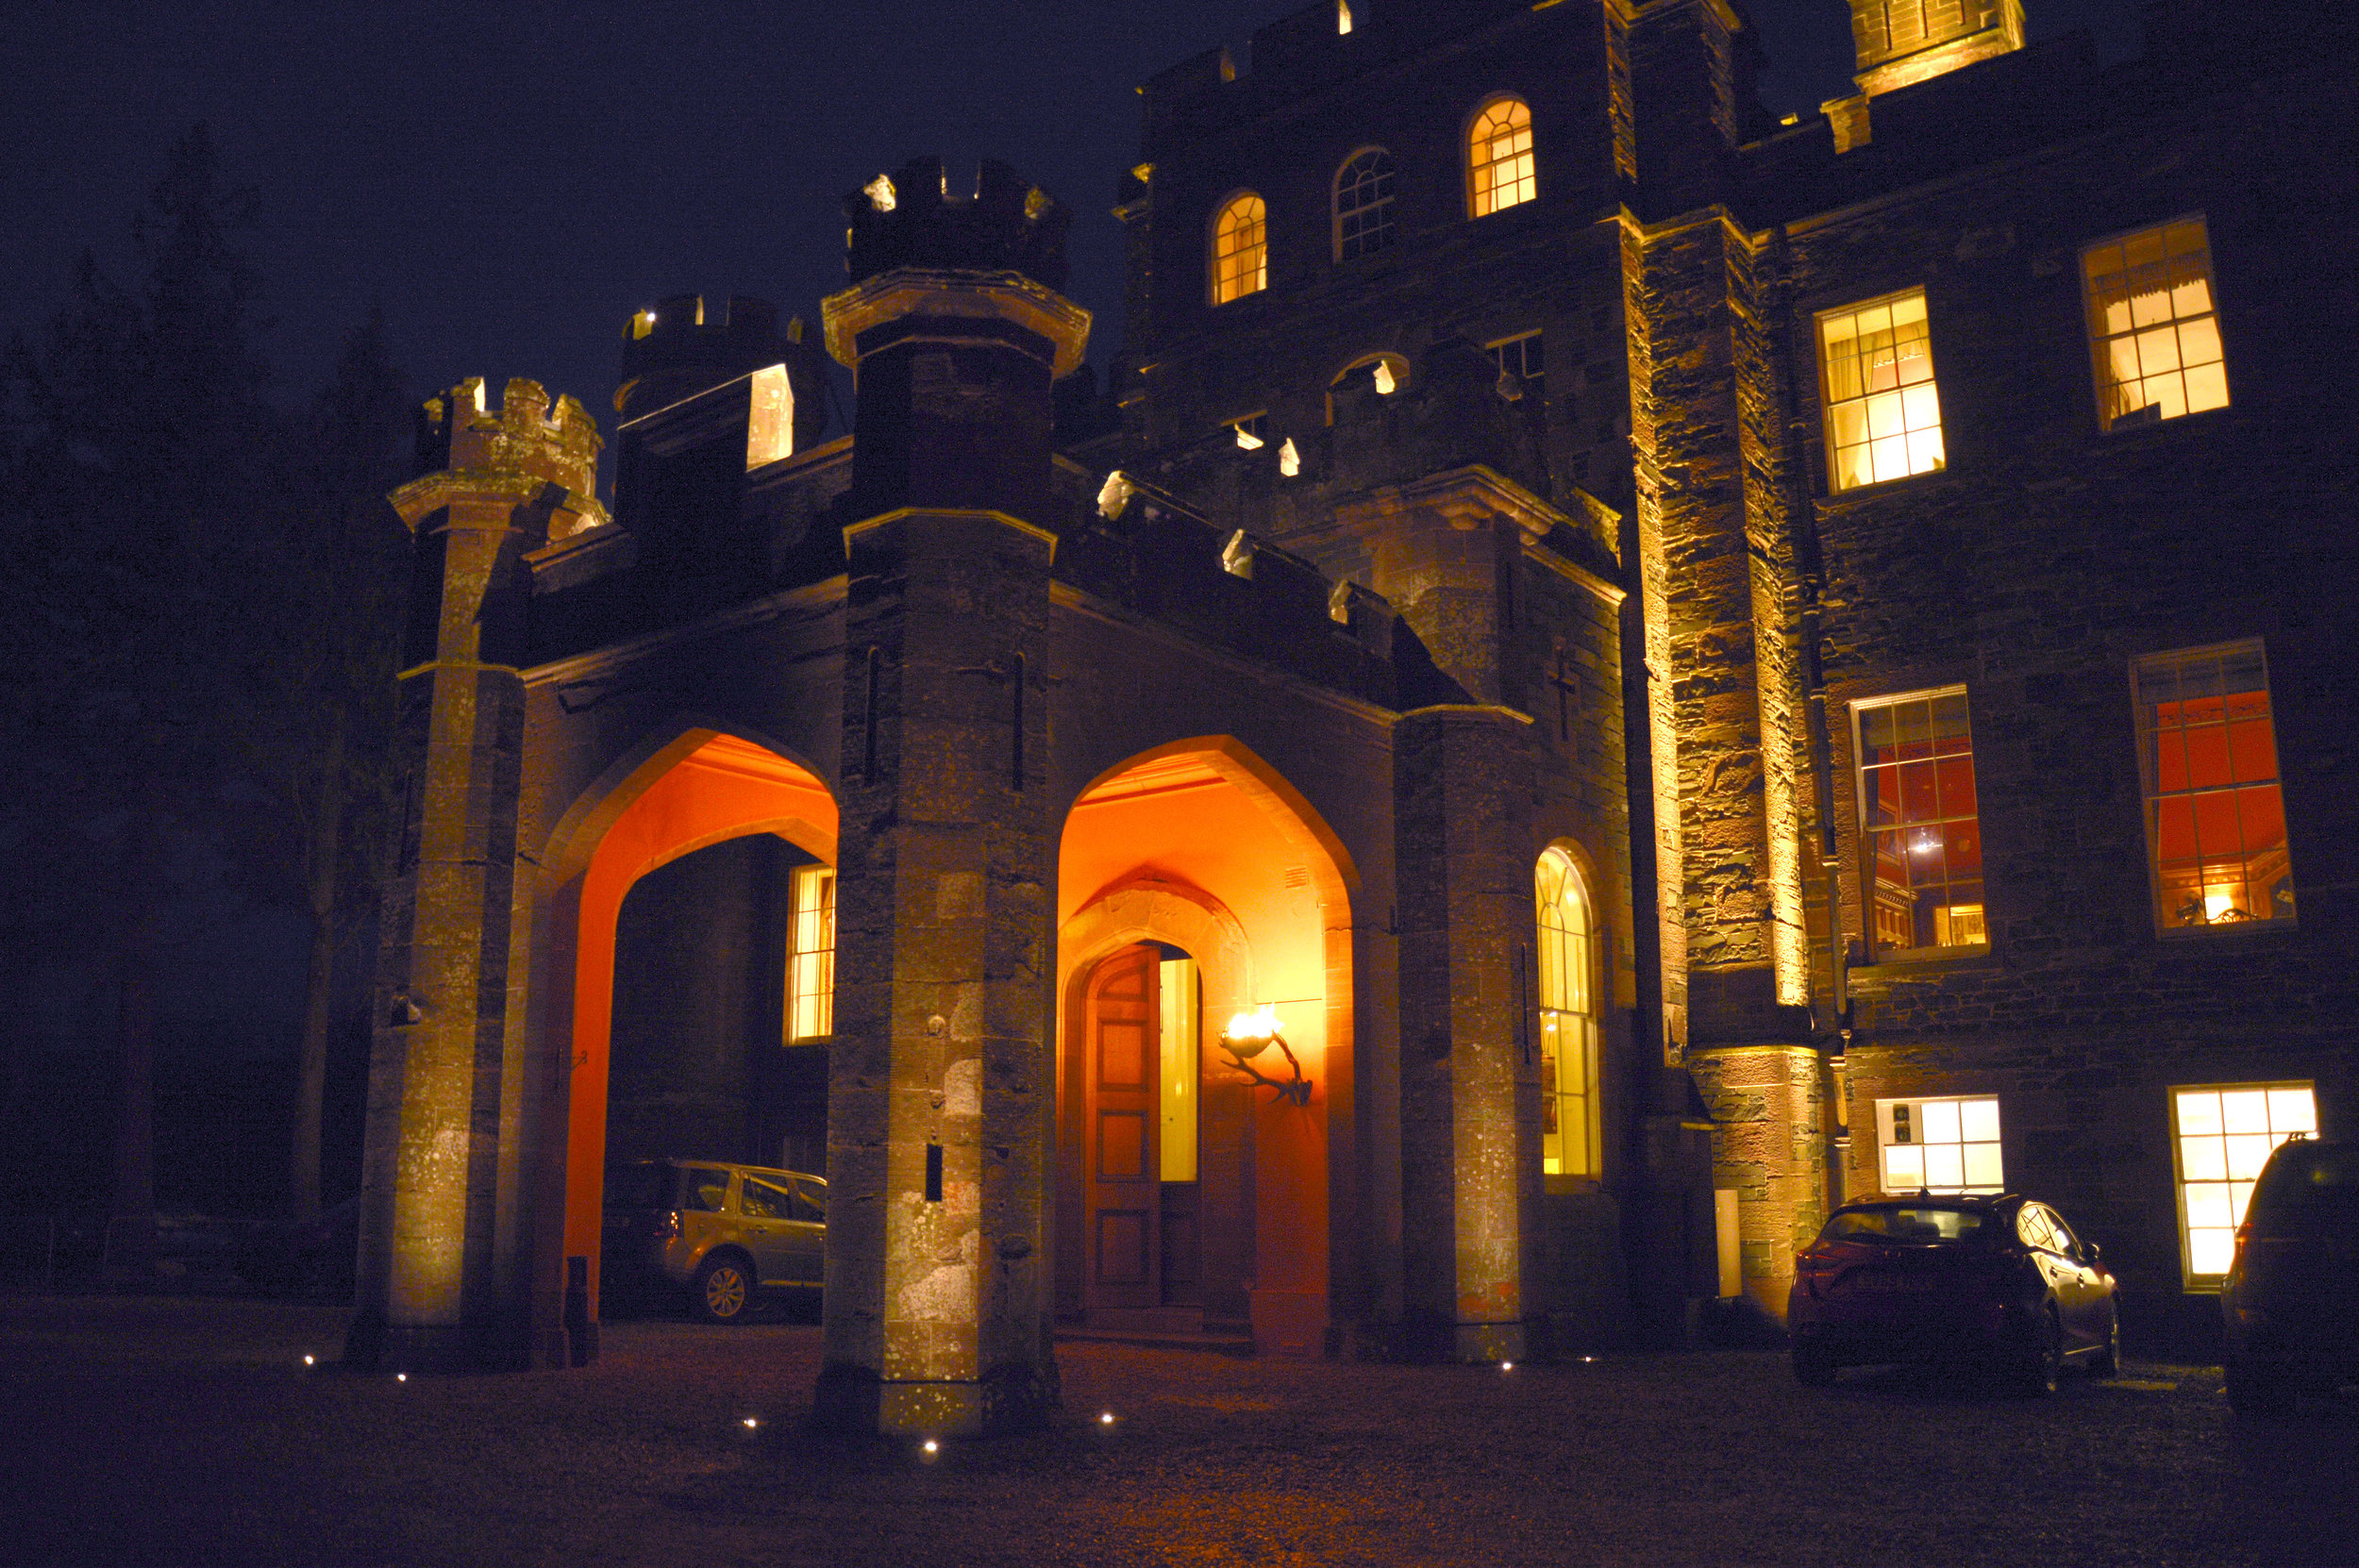
At Kelvin Lighting's 10 year birthday party, KSLD’s Eric Berntsson got the opportunity to demo his VR models for architects and lighting designers. The project demonstrated was one Eric was working on. He took the lighting design KSLD made and turned it into a virtual reality space to illustrate how a potential project could appear in VR. The project is in construction now, so this is a sneak peek at what the finished project will look like. 

Watch below to see what users have seen when they saw things in VR and how the VR compares to reality.

Scott Kelly's reaction alone is worth a look!

More Blogs

Virtual Reality Meets Lighting Design & Architecture.

Eric Berntsson on VR and the challenges and opportunities it presents for lighting designers - take it from one who knows!

2741030309_0f8e3a0ac4_b.jpeg

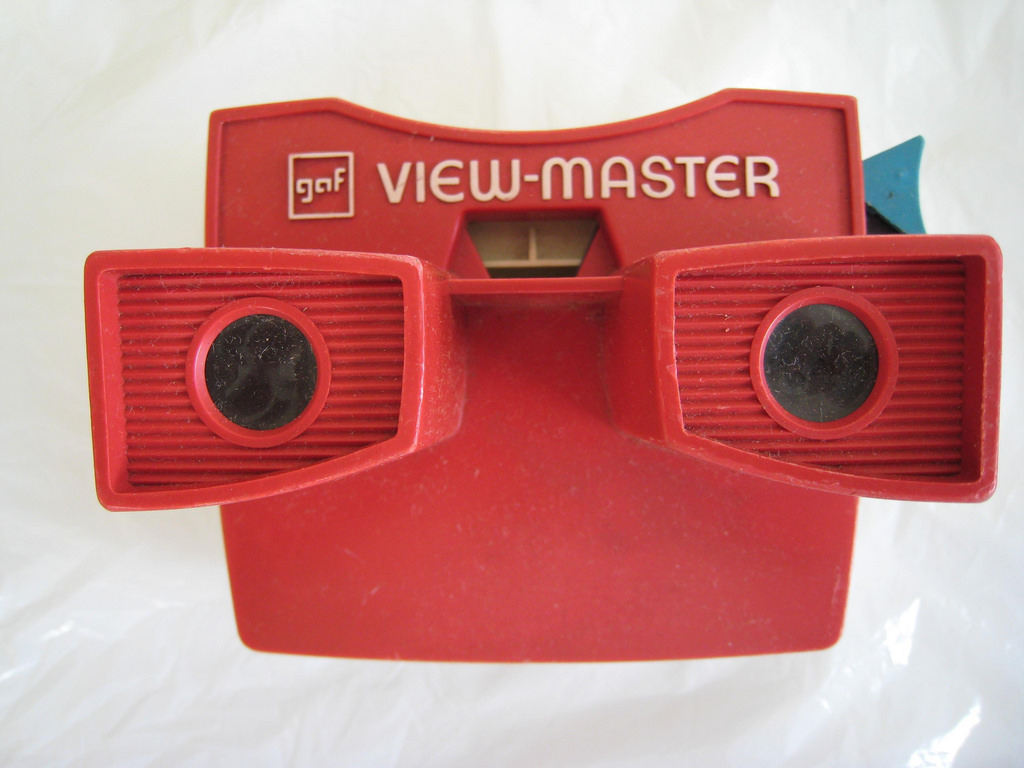
Virtual reality (or VR) has been around for a much longer time than many would think. You can find info about VR headsets dating back to the early 90s.
For most people it’s just a stupid mimic of “The Future”. The reason for this is that the majority of VR headsets that people try on are in general quite bad. You get dizzy, light headed or even nauseous.

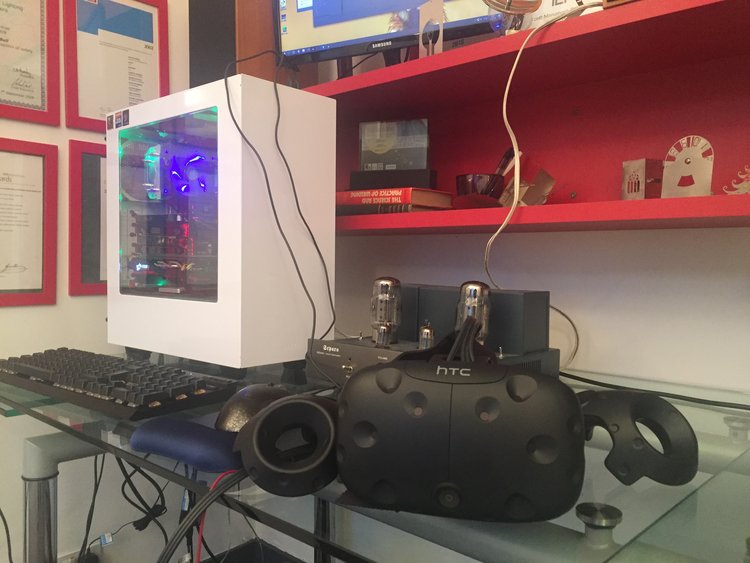
However, if you ever have the opportunity to try one of the newer, higher quality beasts - one that is not an app on your smart phone; one that requires a monster of a computer to bring you all that eye-candy graphics and physics - stay in the queue.

The HTC-Vive is one of these headsets, and it’s the one I decided to buy for myself. The first time you try one of these high end headsets you realize how immersive they really are. You can walk around in the virtual space, pick up objects and look at them in detail.
You want to stand on the Empire State Building? No problem, “Google Earth VR” is out there and you can visit (or revisit) any part of the world.
You want to dive deep under water? Go ahead and try “TheBlu” and freak out when a whale swims next to you.

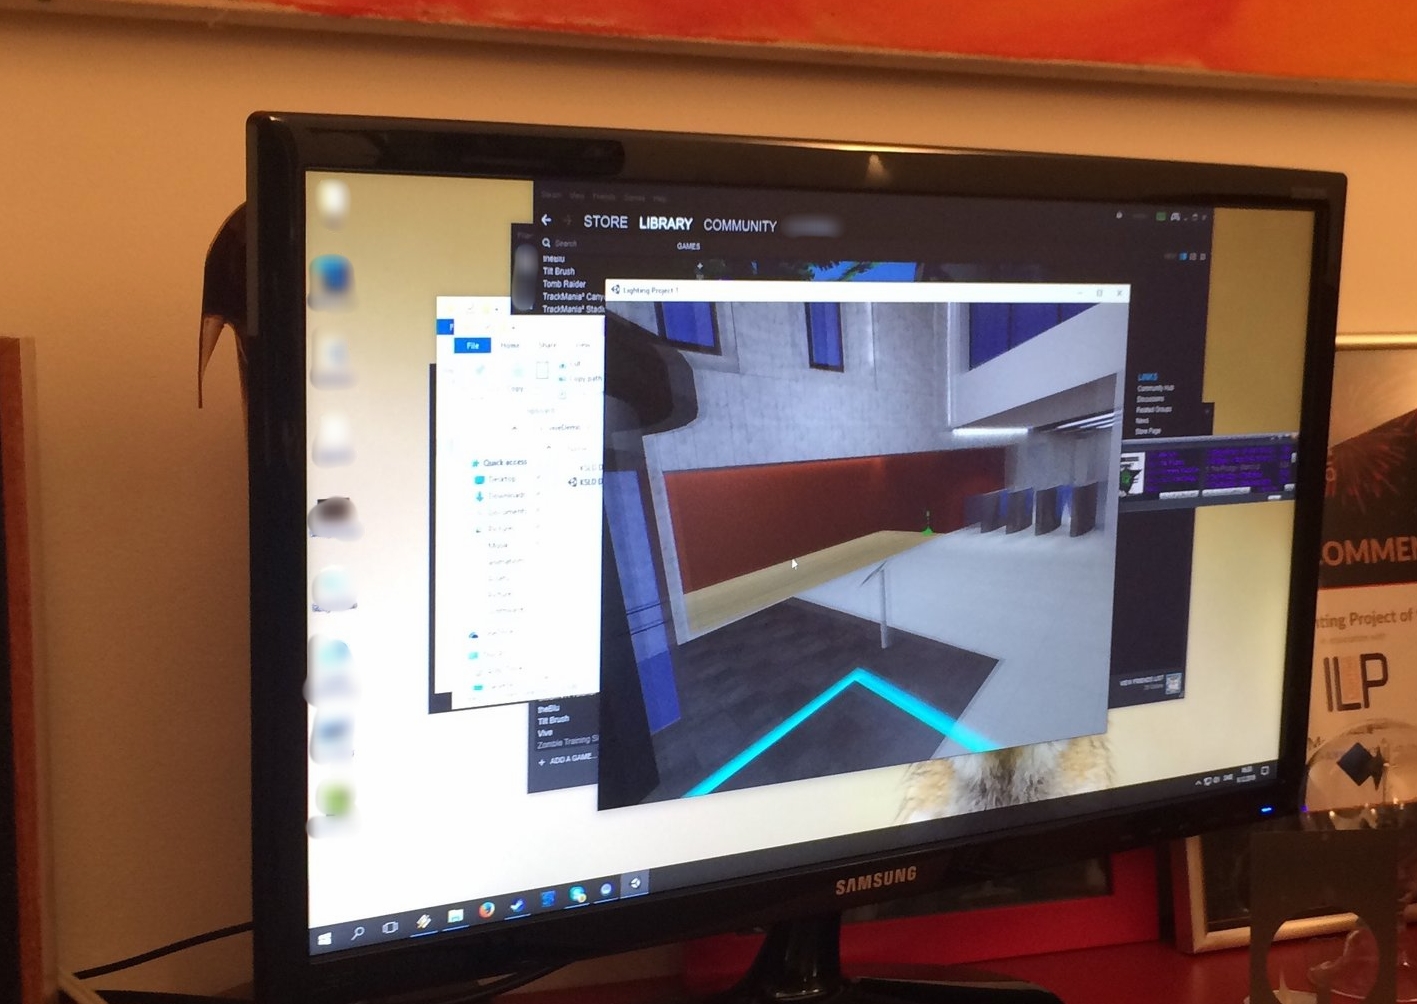
So that is all cool and fun stuff. But what about lighting design and architecture? Well... there is none. There are a lot of educational demos and experiences out there for medical, historic and biological purposes, but no architecture. So I decided to try to model up one of our projects at KSLD myself using Unity - a free development program. Add some textures, load it up in the headset and suddenly you stand in the middle of the project - in real life scale.

The lighting is a huge challenge by itself. linear lighting is not a standard thing you can just throw in a model and move around in real time when using Unity. A powerful computer like the one I own struggles when calculating these things and it took me a good while to get the lighting to look somewhat realistic.

With the problem of good looking lighting solved, I could create more models, try different environments like lobbies, bars and offices. I soon realized that I had quite a few models ready. I brought these in a demo to show the office along with a few invited designers, engineers, and decision-makers.
Putting the “First time in Virtual Reality” shock away, I got some really good feedback on the models and ideas of what to change and add.

One of the joys of owning the headset is to look at other peoples faces when they try out VR for the first time! The future seems to have found its way here after all.

More Blogs