Introduction
Revision A, 22.02.2019
Specifying LED retrofit lamps is part of the daily life of lighting designers, especially on hospitality projects. There is a great range of LED filament lamps on the market, especially E27 base, that claim to be dimmable. On many projects, decorative fittings use G9 rather than E27 lamps. The cost of decorative fittings using G9 or E27 lamps is less than fittings with integral LED modules. Many companies are not producing decorative fittings with integrated LED. While LED retrofit G9 lamps might sound like a lighting designer’s nightmare, there are a few companies available on the market that offer dimmable G9 LED lamps. Is it a dream come true or a continual nightmare?
As part of one of our recent hospitality projects, we decided it was necessary to test a few of these products for their dimming ability and control.
Methodology
Equipment
The equipment used for the testing of G9 lamps is listed below:
- A Pendant fitting with three G9 bases
- Lighting control system with Trailing edge dimming and DALI outputs
- DALI Electronic trailing edge dimmer for incandescent lamps, electronic transformers and line voltage LED lamps
- Control software running on a web interface
- LED G9 dimmable lamps by two different manufacturers
- Halogen G9 to serve as a comparison
- Integration sphere, made in-house
- Conventional light meter
- Assenstek Essence Spectrophotometer
- MiniDSO 211 storage oscilloscope
Process
In order to begin the test, we set different levels of intensity through the control software; the levels rise in 5% steps starting from 0% to 100%, with 3 second fade time.
At the beginning, we dim the lamp up and down from 0 to 100 with 7 seconds fade time to see the general dimming. Then, we start dimming up from 0 and every 5% until 100% to see and record any perceivable difference and flicker behaviour.
After the general dimming test, we repeat the test using the integration sphere. This helped us to take relative light measurements at each dimming level. The measurements taken create the dimming curves that we will illustrate below.
We repeat the test using the trailing edge dimmer and DALI electronic trailing edge dimmer. The minimum rated load for the trailing edge dimmer is not indicated. The minimum rated load for the DALI electronic trailing edge dimmer is 3 VA.
Challenges
Some of the difficulties we encountered while engaging with the test were the relative stability of light meter readings. The light meter was giving varying readings for a particular control setting. An average was taken to draw the dimming curve. In some cases, the light output was visibly unsteady, therefore we assume the variation in meter reading was in response to variations in light output of the lamp being tested through the duration of the reading.
The pendant we used for testing has three G9 bases. In some cases, we encountered the issue of LED lamps being on, even when the level was on 0%. We believe this to be a result of insufficient current to keep the dimmer triac latched off. This can be made worse through the very poor (capacitive) power factor of these lamps. In order to increase the load current, we used the halogen lamp in addition to the tested G9. This allowed us to creating the curves for lamps that could not be individually controlled. In these situations, we are concerned that the actual dimming curve will vary when a resistive load is not applied to the dimming circuits in addition to the LED. However, the dimming curves of the LED still diverge from what we would expect.
Results
Lamp 1: Halogen G9 40W
Halogen lamps used to be the dominant light source in residential applications. They are known for their quality of light and specific dimming behaviour. Halogen lamps are being taken off the market by EU regulations. We tested the halogen lamp in order to use it as point of reference for LED retrofit lamps.
When using the trailing edge dimmer, the lamp started visibly illuminating at 25%. The perceived fading up lasted until 90%-100%. While dimming down, the lamp stayed on until 20% and then faded off completely. The change in colour temperature of the lamp was not considered during this test.

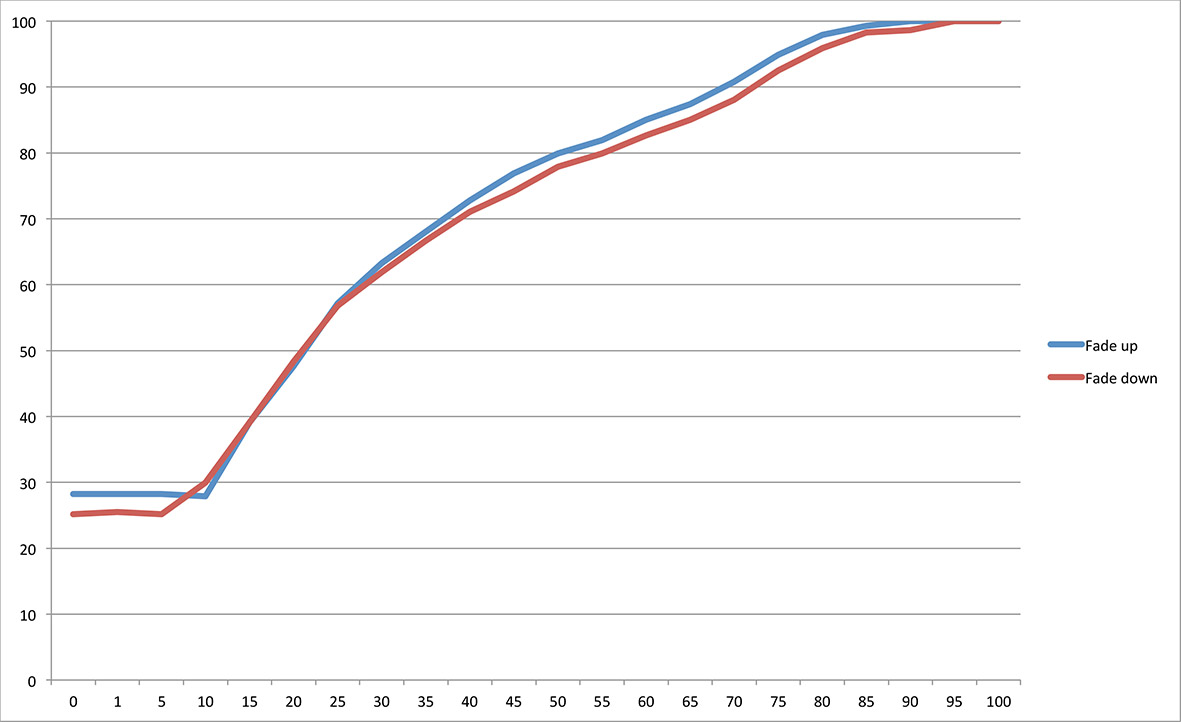
G1: This graph shows the dimming curve of the halogen lamp on the trailing edge dimmer
The graph shows a logarithmic curve that reaches a plateau at 90%. While on the trailing edge dimmer, the fading up and fading down curves are quite distinctive. While fading down, the light readings resulted in higher values than those during fading up. This must be caused by the internal control circuitry in this dimmer.

G2: The graph shows the dimming curve of the halogen lamp on the DALI trailing edge dimmer
The behaviour of the lamp stayed similar while fading both up and down, following a logarithmic curve. One of the main differences was that the lamp visibly illuminated from 1% gradually until 100% without reaching plateau.

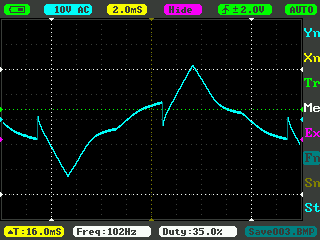
G3: Graph of halogen lamp on mains dimming at 60%

G4: Graph of halogen lamp on DALI trailing edge dimmer at 60%
What is the reason for the changing behaviour? A look at the graphs from the oscilloscope might give us a better understanding.
We can see some differences in the traces. Firstly, while they are taken from the same level, the curve is not cut at the same point. It seems that when the lamp is on, the mains dimming the curve is almost cut at its peak point, while on the DALI dimmer, it is cut at a lower point. In addition, the flat line looks smoother on the DALI dimmer than on the mains dimming. Both these devices are exhibiting different dimming curves and different trace patterns indicating different electronics to achieve the same anticipated results.
Lamp 2: LED G9 Dimmable 3W
After testing the halogen lamp, we continued the process testing LED dimmable G9 lamps from different manufacturers.
We have just one product type of Lamp 2. When we placed it to the pendant and on the trailing edge dimmer, the lamp was on at 0%. At 10%, it flashed once and started fading up from 15%. It seemed to reach a plateau at approximately 50-60% as there was no significant change in intensity after 60%. The perceived fading down of the lamp started at 20% until 5% while it stayed on at 0%.
G5: The graph shows the dimming curve of the single Lamp 2 on the trailing edge dimmer
The curve seems to be a square root curve which reaches a plateau at 90%. There are slight differences in the curves while fading up or down, while the lamp stayed on at 0%.
In order to stabilise the dimmer, we used the halogen lamp to increase the load, and repeated the test.
When Lamp 2 was placed with the halogen lamp, its dimming behaviour changed radically. Firstly, Lamp 2 was off at 0%. It turned on at 10% with a little delay and started dimming up gradually until 80%. At 85% there was a big step change in the intensity and then a gradual fade up at 90% when it reached plateau.
Lamp 2 started fading down at 85%. At 80% there was a big step change in intensity and then it gradually faded down until 5%. At 5% it stayed on for a while but then turned off after few seconds. It stayed off at 0%.

G6: The graph shows the dimming curve of Lamp 2 with the halogen lamp on the trailing edge dimmer
The graph shows a slightly off-linear dimming behaviour that reaches plateau at 90%. The fading up and fading down curves show slight differences, as the lamp stayed on, even for just a few seconds at 5% while fading down, although it only turns on at 10% with a little delay. It seems that the change in the load smoothes the square root curve of Lamp 2.
We repeated the test using the single Lamp 2 on the DALI electronic trailing edge dimmer. The lamp was on at 0%. Its intensity was significantly less than when it was on the mains dimming. It stepped up at 1% and then gradually faded up until 100%. While dimming down, the lower levels seemed to be brighter than when the lamp was fading up.

G7: The graph shows the dimming curve of the single Lamp 2 on the DALI electronic trailing edge dimmer
The dimming behaviour resulted in a linear curve with two peak points in the beginning at 1%, and at 95% at the end. While the first peak step was quite obvious to the naked eye, the second peak was not as perceivable as shown in the graph.
We repeated the test again using the halogen lamp to increase the load.

G8: The graph shows the dimming curve of Lamp 2 with the halogen lamp on the DALI electronic trailing edge dimmer
As was the case on the trailing edge dimmer, the presence of the halogen lamp smoothed the linear curve of Lamp 2. At the first peak at 1%, the lamp was obviously flickering. It then seemed to stabilise at 15%. The high peak was clearly perceivable from 90 to 95%.
A look at the traces from the oscilloscope demonstrates the differences.

G9: Single Lamp 2 on mains dimming at 10%

G10: Lamp 2 with halogen on mains dimming at 10%

G11: Single Lamp 2 on DALI electronic trailing edge dimmer at 10%

G12: Lamp 2 with halogen on DALI electronic trailing edge dimmer at 10%
When Lamp 2 is placed along with the halogen lamp, the diagrams look more as expected. Even here, we can see significant difference at the cut point of the curve, as when the lamp is on the DALI dimmer, the cut point is higher than when on mains.
The diagrams relating to Lamp 2 when the single lamp is in the pendant, look quite different to what was expected. When on mains dimming, it seems that the wave never quite reaches a flat linear value, while on DALI dimmer, it seems to get closer to linear values, although we still cannot see the same linear curve as when Lamp 2 is placed along with the halogen lamp.
There are some very significant interactions between the electronics of the dimmers and the electronics in the lamps, particularly when there is a low load on the dimmer. This accounts for the unpredictable dimming and flickering.
Lamp 3: LED G9 Dimmable 5W
We continued the experiment with another LED lamp, from a different manufacturer. We had three items of the same product so that we could use them all at once on our pendant. This provided a more realistic situation, and at 15W, a minimum load.
The lamps were off at 0%, and started slightly turning on at 30%. Then, they gradually faded up until 95%, when they seemed to reach plateau. The lamps started gradually fading down after 90% until 40%. They turned completely off at 25%.

G13: The graph shows the dimming behaviour of 3 x Lamp 3 on trailing edge dimmer
The dimming curve tends to match the logarithmic curve of the halogen lamp, although it has a smaller curve radius that looks almost linear, with a starting point of 25% as 0.
We repeated the test, dimming the lamps with the DALI electronic trailing edge dimmer.
Lamp 3 started to be very slightly on at 15%, and gradually faded up until 100%. While dimming down, it gradually faded off until 10% when it turned completely off.
One of the main differences in behaviour of Lamp 3 while on the two different dimming systems was that on the DALI electronic trailing edge dimmer, the lamp flickered and looked unstable below 45%. This behaviour was not visible when the lamp was on the trailing edge dimmer.

G14: The graph illustrates the dimming behaviour of 3 x Lamp 3 on the DALI electronic trailing edge dimmer
The dimming curve smoothed into a logarithmic curve, although slightly different from the curve of the halogen lamp.
A look at the traces from the oscilloscope provides us with an interesting comparison.
G15: 3 x Lamp 3 on mains dimming at 30%

G16: 3 x Lamp 3 on DALI electronic trailing edge dimmer at 10%
The two traces are quite different. The second trace looks more like what we would expect than the first trace. The cut point of the wave seems to be the same. The flat line of the second graph looks a little shaky, while it is completely distorted on the first trace, creating more curves.
Commentary
Our experiments showed that each lamp displayed different dimming behaviour on the different dimming systems. The dimming curves seem to be smoother when the lamps were on the DALI electronic trailing edge dimmer. In addition, they demonstrated a greater dimming range.
How much of this range we can actually use or perceive? As discussed in the Lamp 3 results, the lamp demonstrated visible slow flicker, and was unstable for almost half of the dimming range. This behaviour was not visible on the mains dimming. However, the dimming range of Lamp 3 on mains dimming was much reduced, compared with when the lamp was on the DALI dimmer.
Lamp 2 demonstrated a greater dimming range on both dimmers. However, in both situations it needed the presence of the halogen lamp in order to stabilise the load and to ensure the lamp is turned off at 0%. In addition, it seemed that the DALI dimmer smoothed the dimming behaviour, even when there was a single Lamp 2 in the pendant.
Conclusions
On the basis of the testing undertaken so far, we do not believe that there is a safe specification for dimmable G9 lamps. We expect to see different performance depending on lamp type, dimmer type and total load per circuit. Dim to extinction is also unreliable and will vary with the load (number of lamps) per circuit, different wattages of lamps and different makes of lamp.
As different lamps of similar specification and performance show distinctly different curves, lamp replacement also becomes a potential problem, requiring the attendance of a controls programmer to re-set scenes according to the performance of new lamps.
Many of the lamps we received were in generic boxes, and most were not properly labelled to comply with EU EcoDesign regulations. The majority of lamps were purchased through online retailers, both specialist lamp sellers and Amazon. One manufacturer sent us a sample lamp, and within a week had sent another sample to the same specification. The only differences were the size of the box, the printing to the base of one lamp, the envelope of the other, one visibly different electronic component, and different codes printed on each lamp.
It is not safe to assume the performance of, or to specify any of these products without a significant disclaimer as to their performance, and putting the onus on the installing contractor to undertake the necessary testing on site before bulk ordering lamps for any project.
Be sure to follow our posts, as we will continue experimenting and publishing our results. Until then, enjoy a small video demonstration of the varied dimming behaviour of three different lamps on mains dimming.
Claire Tomara and Kevan Shaw, February 2019
Revision A, 22.02.2019
We recognised that the breaks appearing in the graphs relating to Lamp 2, in the earlier version of this report, were due to the auto-range error of the light meter. We repeated the readings using a light meter with controlled error range. We updated the graphs for Lamp 2 accordingly.